
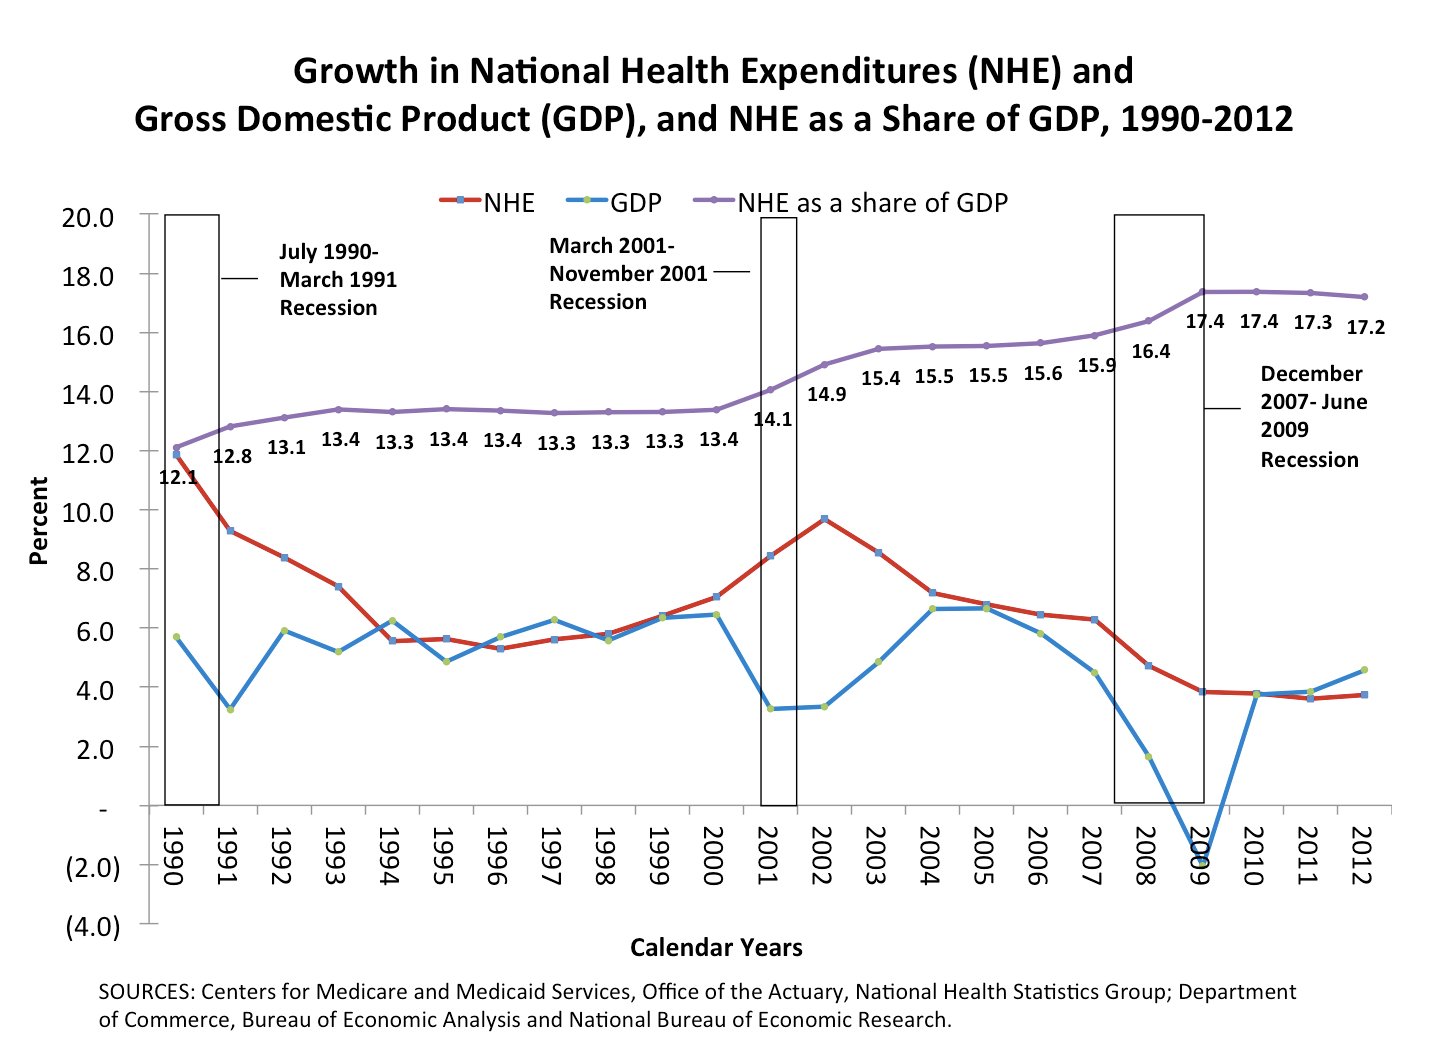
For the first time in more than a decade, health care spending grew more slowly than the U.S. economy from 2010 to 2012, according to a new report by government auditors.
Total U.S. health care spending was $2.79 trillion in 2012, up 3.7 percent from the previous year -- that amounts to 17.2 percent of the national economy, the Office of the Actuary at the Centers for Medicare and Medicaid Services conclude in a report published by the journal Health Affairs. It's the first time since 1997 that health expenditures didn't outpace the gross domestic product.
The historic slowdown in the growth of health care spending since 2009 -- the lowest rate since the federal government began tracking the data in 1960 -- has sparked a debate about its causes. President Barack Obama partially credits elements of the Affordable Care Act, such as reduced fees for hospital services, for reduced inflation in national expenditures, but there's no consensus among experts. The actuaries at the Centers for Medicare and Medicaid Services are among those who believe the phenomenon is nothing more than a repeat of normal patterns that occur during and after economic recessions like the one that began in 2007.
"The trends that we've seen in the last few years are consistent with the historical relationship that we've seen between health spending and overall economic growth," said Aaron Catlin, the deputy director of the National Health Statistics Group within the actuary's office, during a press briefing Monday prior to the report's release.
Expenditures on health care, including everything from hospital procedures to prescription medicines, rose less than 4 percent a year from 2009 through 2012, after growing by an average of more than 7 percent from 2000 through 2008 and by double digits in the previous decade.
In November, the White House issued a report highlighting slower health care spending growth and emphasizing that some categories of spending, especially by Medicare, aren't related to the economic cycle because those benefits aren't affected by job loss or other phenomena. The health care reform law reduced Medicare payment rates to hospitals and instituted other measures aimed at cutting spending and improving health, such as barring payments to hospitals when they re-treat patients for the same condition within 30 days.
From 2010, when Obama signed the Affordable Care Act, until the end of 2012, however, the actuaries could discern only a meager impact from the law on national health care spending, said Anne Martin, an economist at the Office of the Actuary, during the press briefing. During that period, the law increased U.S. health expenditures by no more than 0.1 percent, she said.
"While our historical data cannot parse out the spending that was directly the result of the ACA, the projections model showed that there was minimal impact from the Affordable Care Act on aggregate national health expenditure trends from 2010 through 2012," Martin said.
A 2012 report by the Office of the Actuary projected that expanding coverage to tens of millions of individuals via the Affordable Care Act would increase national health spending by one-tenth of a percentage point each year through 2021, compared to what expenditures would have been absent the law.
The new actuaries' report attributes recent levels of annual growth mainly to individuals who lost jobs, or at least lost their health insurance, during the recession and the sluggish recovery. "The period of stability is consistent with the historical experience when the share of GDP tends to stabilize after an overall economic recession, usually two to three years," Catlin said.
In 2012, the low rate of growth was a combination of decreases in some areas and increases in others. Spending on Medicare private health insurance premiums, prescriptions drugs and nursing-home care rose more slowly than during the previous year. Hospital, physician, Medicaid and consumers' out-of-pocket costs accelerated in 2012 compared to 2011.
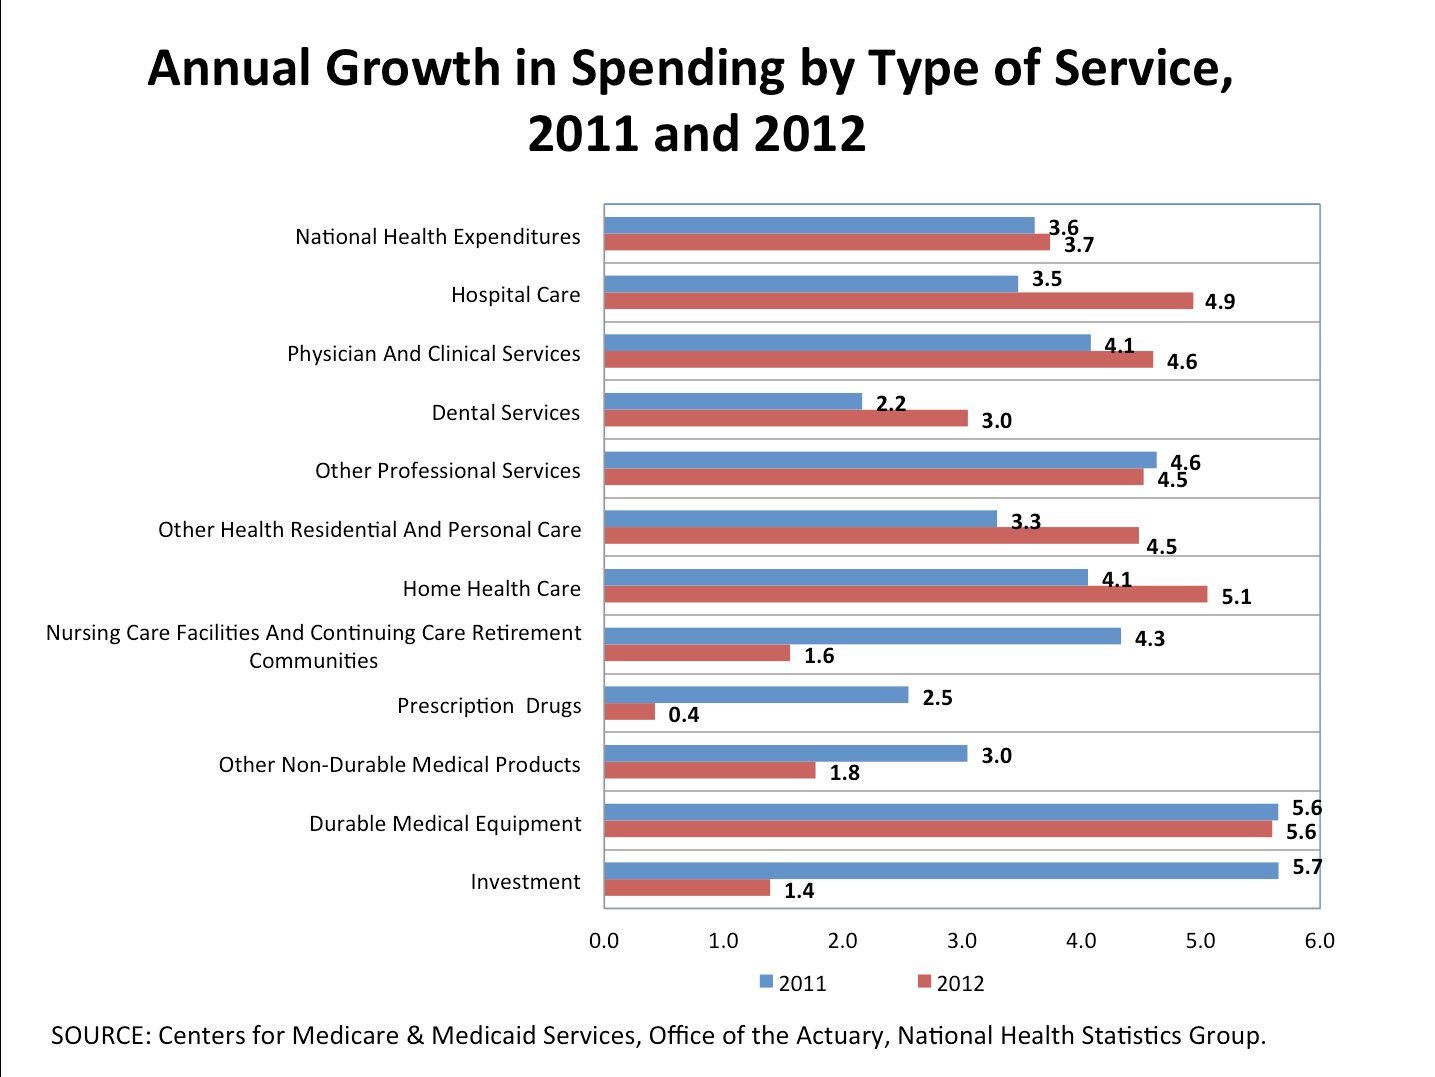
The uptick in spending growth on hospital care and visits to physicians, urgent care centers and other clinics was driven by patients receiving more, and more intensive, services, rather than by price increases, according to the report. Medical prices grew 1.7 percent in 2012, down from a growth of 2.4 percent in 2011. The increase in the use of health care services was partly based on more individuals having health insurance as a result of the economic recovery, the report suggests.
In September, the Centers for Medicare and Medicaid Services issued a report projecting that health care spending growth would remain below 4 percent in 2013 but would accelerate in later years. This year, as the Affordable Care Act expands health coverage to the uninsured, the spending increase will surpass 6 percent for the first time since 2007 and the law will account for 1.6 percentage points of that rise, that report predicts.
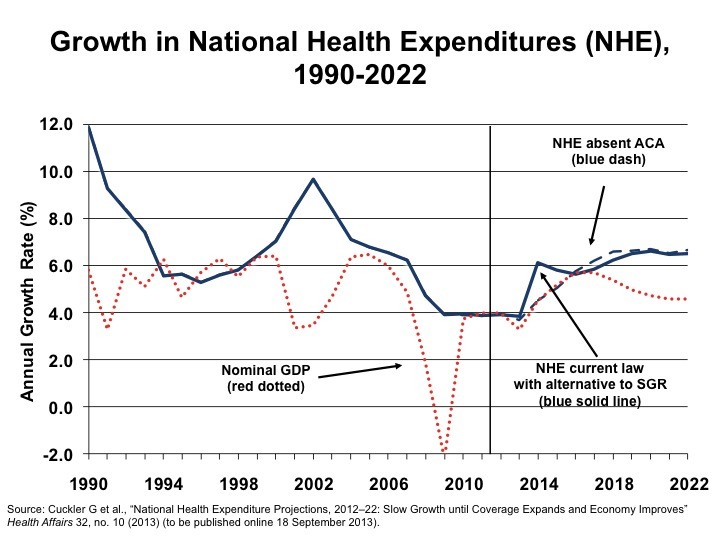
Note: ACA refers to the Affordable Care Act. SGR refers to the system that determines how much Medicare pays physicians. The Office of the Actuary assumes Congress will prevent scheduled cuts to doctors' pay, including a 24.7 percent reduction set to take effect Jan. 1.
CORRECTION: A previous version of this post misstated the period over which growth in health care spending was outpaced by the GDP.

- Contribute to this Story:
- Send us a tip
- Send us a photo or video
- Suggest a correction
0 comments:
Post a Comment